ThereminGoat
Oct 1, 2022
•9 minutes
Keyboard Switch Force Curves Explained
In this article, expert switch collector ThereminGoat explains the ins and outs of keyboard switch force curves so you can read them with confidence.

Gateron Baby Kangaroo Switch opened
If you’re deeply interested enough in switches and keyboards to be reading a blog post like this one, there’s a fairly strong chance you have seen what is known as a ‘Force Curve’ before. Surprisingly, though, there is a large amount of people in the mechanical keyboard hobby who don’t know how to make usage of these awesome pieces of data. That’s not to say that this is by any fault of their own, either, as force curves for switches are definitely a little unintuitive at first glance. So, in order to help out in demystifying these incredibly helpful graphs, I’ve teamed up with Kinetic Labs in order to provide a little bit of insight as to how force curves are made, where you might find them, and just a few of the pieces of information you can glean from them.

Force curves for over 200 different switches on GitHub
Starting at absolute ground zero as an introduction, I think it would be in good interest to start by describing what a force curve is and what it is not. A force curve is a force versus displacement graph made for a switch being pushed in and then released, coming fully back to rest. The graph displays a pair of lines showing how the force of the spring in the switch changes at various different points in the switch such as at the tactile bump (if it has one) or at bottoming out. In a much more abstract sense, these graphs provide us visual information to match some of what we feel when we are testing out switches. Unfortunately though, force curves are not the ultimate piece of switch feeling information as they are not capable of quantifying or displaying smoothness of a switch. (Of course unless you lube your switches with a handful of Vaseline…)
Force curves for switches are collected using force-displacement measurement devices that vary in terms of their accuracy and costs. While there are a few individuals in the keyboard community such as Pylon and HaaTa who have managed to rig up their own devices to create force curves, many professional companies and vendors use higher end, laboratory-grade equipment that can cost many thousands of dollars. For example, my force curve tester which makes all of my force curves is an Imada FSA-MSL-0.4, which is the same instrument that two of the largest vendors in keyboards use for testing their own switches! Another reason I use this specific instrument, and why it costs as much as it does, is because it has an extremely fine-tuned connection between the movement stand and the force meter, labeled in the photo in below. This fine-tuned connection allows for super precise measurements at any point in the upstroke or downstroke of the switch.
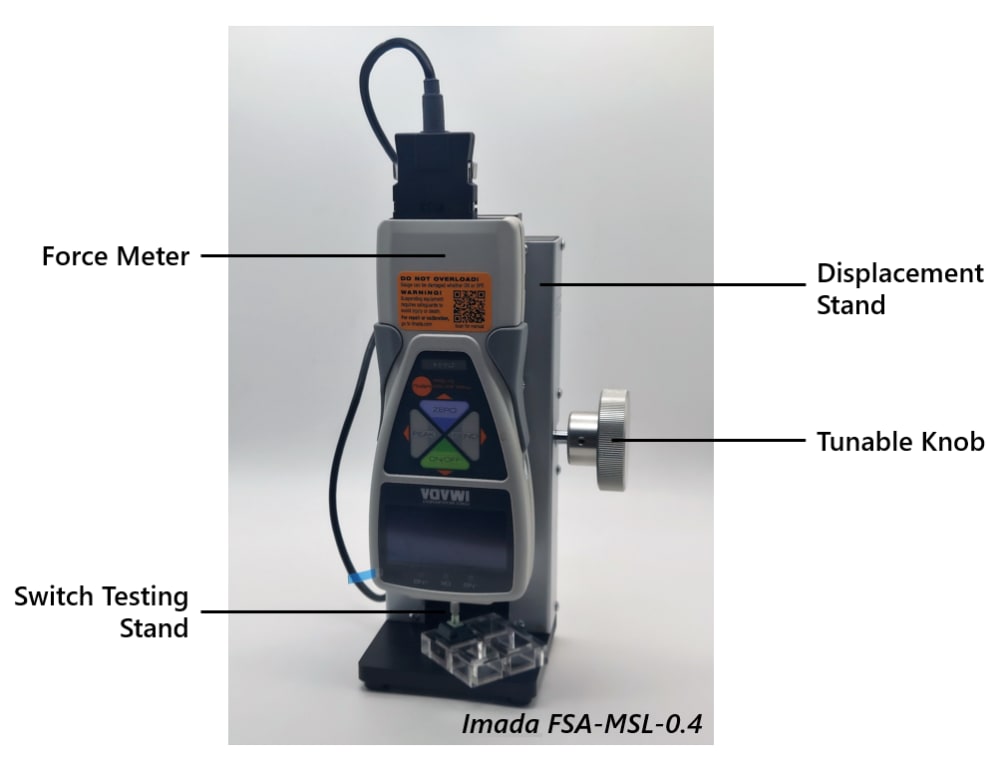
Force-Displacement instrument for force curve collection.
When collecting a force curve, I place a single switch at the base of the testing stand directly underneath that of the grey force meter. I then slowly raise and lower the stand using the tunable knob on the right-hand side which causes a little nub on the end of the force meter to act like a finger and push the switch stem in and back out. (Even fancier models of force curve testers have an automatically moving detector.) Dozens of times per second, the device records the exact force at which the spring is pushing up against the stem of the switch, keeping track of it until the end of the press is done. In the end, the software compiles all of this data into what you have come to recognize as a force curve. I often like to touch mine up and do some stylization as well, which is why mine don’t look quite as rough as when they come directly out of the software.

Kinetic Labs Gecko Switch Force Curve
While the usage of force curves by various vendors has started to increase over the span of the last couple of years, historically only manufacturers ever really displayed these graphs. Found on ‘specification sheets’ as well as rarely in advertisements, it is a shame that so few people interested in keyboards have ever been introduced to these graphs as they pack in a ton of useful information. Looking just at my labeled force curve diagram that I have for the Gateron Baby Kangaroo switch, below, you can see there is quite a few obvious points that you could pick out. First and foremost, you must keep in mind that the top line (in solid red) is that of the downstroke force curve and that the bottom line (in dashed blue) is that of the upstroke force curve. (Remember: Downstroke = Pressing the switch down with your finger. Upstroke = Releasing your finger and letting the switch reset.) With this in mind its easy to see just how quickly you can tell what type of switch it is, the bottoming out weight of the switch, and how far the travel of the switch is!

Gateron Baby Kangaroo Switch Force Curve
In my opinion, the strongest point where force curve diagrams can help out the average mechanical keyboard enthusiast is in differentiating between different types of tactile switches. While it’s hardly ever discussed in such clean terms, tactile switches effectively have two different metrics which dictate how they feel: The strength (force) of the tactile bump and how long the tactile bump is. Without having ever even tried a tactile switch, it’s pretty easy to understand that tactile feedback that is really strong and sharp would likely feel very different than a soft, drawn-out tactile bump instead. The tactile bump length is easy enough to see as you effectively just figure out where it starts and where it stops alone the x axis, with ‘long’ tactile bumps taking up well over 60% of the entire length of the force curve from the start to bottoming out. ‘Short’ bumps, on the other hand, often take up less than 40% of the overall bump distance. As well, the strength of the tactile bump can be estimated by how tall the peak of the bump goes up relative to where it first starts, with strong tactile bumps sometimes jumping up well over 10 or 20g of force at the top. With those few details to look out for, look at a comparison of Cherry MX Browns and the Kinetic Labs-exclusive Penguins below!

Force Curve Comparing Kinetic Labs Penguin and Cherry Brown
I do want to especially note before the end of this post, though, that force curves aren’t exactly the magical answer to perfectly describing how switches feel. You may think that the stronger and longer a tactile bump is that it may translate to x, y, or z feeling, but in reality, how keyboards work and how we perceive feeling can vary from just the up-and-down force of switches. While this means that force curves aren’t the perfect way of quantifying how switches feel, I hope you’d agree that they can be really useful in helping provide details that some vendors are a bit uncertain about. (Don’t worry though, I have made sure the Kinetic Labs crew has this on lock.) With that, I hope that you all have learned something new and exciting about force curves today and that it will help you find your next favorite switch for your endgame build!